Magora › Projects › Audience Management
Media & analytics · Case study 2017

Audience Management.

Analytics software for a TV broadcaster: audience reach and channel popularity turned into interactive pie, bubble and pyramid charts for programmers and advertisers.

Client
Audience Management
Industry
Media & analytics
Timeline
3 months
Team
PM · 2 front-end developers · back-end developer · QA
Year
2017
Services
Discovery · Design · Build · QA
Delivery
Magora London
Domain
Media & analytics
Engagement
Time & materials
Team
PM · 2 front-end developers · back-end developer · QA
Built by Magora

This Audience Management project was designed and built by Magora. We are a London software development company (since 2010) building custom software, web and mobile apps for UK businesses, from a free working prototype to launch and support.

Bespoke software development → Free working prototype in 5–10 days

Client & context

A TV broadcasting company commissioned us to build analytical software for its audience data. Programmers and advertisers needed to understand audience reach and how popular each channel was.

The challenge

Audience statistics are large and multi-dimensional - channels, time slots, demographics. Static reports made it slow to spot patterns. The client wanted an interactive way to explore the data that people outside the analytics team could use.
What we built

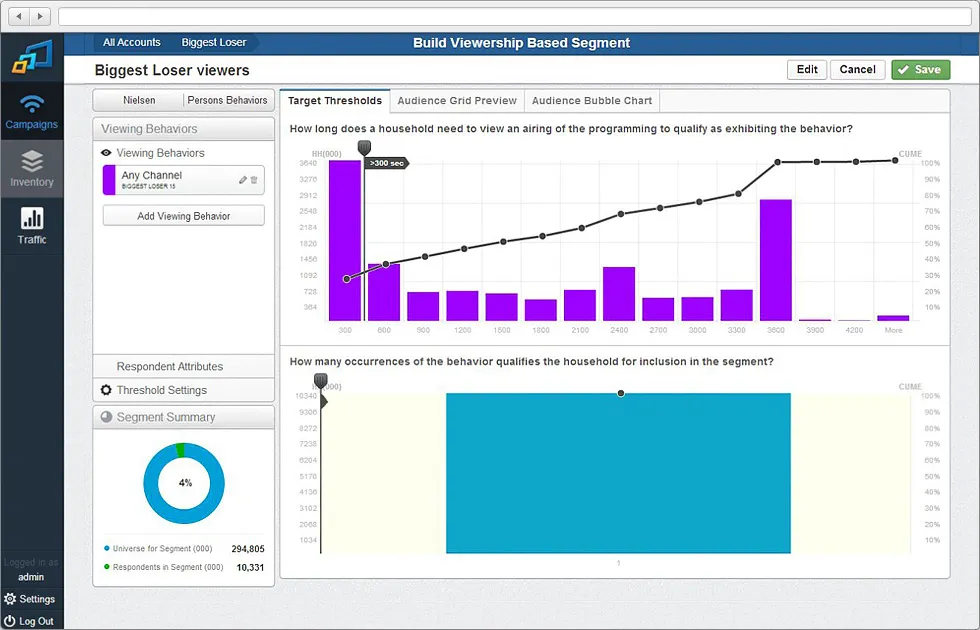
We built a data visualisation system on the D3.js library, which renders data with HTML, SVG and CSS:

  • the system retrieves audience data from the database and runs the analytical operations client-side, so exploring is fast;
  • results appear as interactive charts - pie charts, bubble diagrams and pyramid charts;
  • users can filter by channel, period and audience segment.

Process & timeline

We prototyped the chart types with the client's analysts on real data before building the full system, to make sure each chart answered a question they actually ask. Delivery took 3 months.

Audience Management — solution

Results

The Audience Management System makes reach and channel popularity easy to analyse and is used by TV programmers and advertisers.

Programmers and advertisers could explore reach and channel popularity themselves instead of waiting for static reports.

At our current rates, a build of this scope would cost about £12–28k — an estimate from the feature list, not the original invoice.

If we built it today

Today we would keep D3.js for the charts and add saved dashboards, scheduled reports by email and role-based access for advertisers and internal teams. A first release of a product like this typically takes 6–8 weeks; our rates start from £49/hour per developer, and £65–£70/hour for a full team with QA and product ownership. Discovery starts from £3,000.

Building something similar? See our bespoke software development services, or estimate your project in the cost calculator.

The numbers after launch.

3
Chart types: pie, bubble, pyramid
D3.js
Client-side analytics, no page reloads
3 months
Delivery
£12–28k
Est. cost at today's rates

Built with what holds up at scale.

D3.js jQuery HTML5 CSS3 SVG
Got a similar problem?

Want your project on this page next?

30-minute call with the team behind this build. We'll tell you what we'd actually do in your shoes — no decks, no pitch.

Book a call
— Cookies

We use cookies to measure traffic and make our marketing more relevant. Necessary cookies stay on. See our Privacy and Cookie Notice.

Free 30-min consult Free consult