Gmail Metrics

Gmail Metrics

Brief

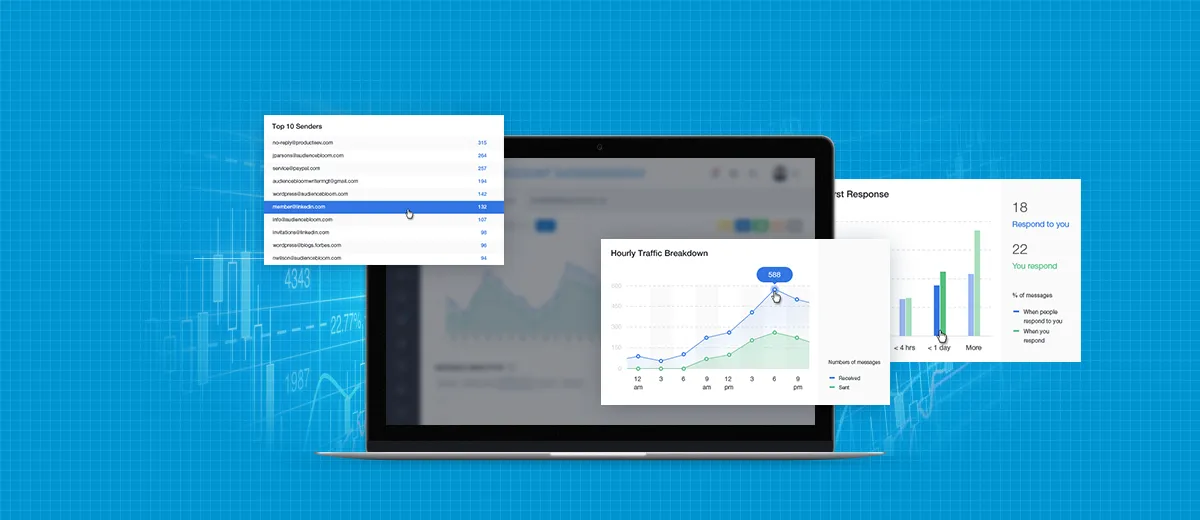
A short time ago, Magora’s designers finished a new web project that covered email metrics. Our customer, from the USA and owner of his own SEO agency, approached our web creation division with a request to make a web app for statistical data collection of activity on Gmail. He wanted to use different kinds of graphs and metrics in this app that would allow users to track email traffic and to receive analytic reports on corporate inboxes.

Our client recognised the need here, because he understood how prevalent email is as a means of communication in every industry, uniting partners and serving as a tool for collaboration. That translates into a tremendous amount of information that is accumulating there, and sometimes it is difficult to sift through that mess. As a result, his team wasn’t often able to work effectively.

Magora is a team of professional app developers, and we are committed to helping our customers identify and obtain the necessary instrument for attaining true success in business.   That’s why, for this task, Magora’s developers crafted a new web app interface design, Gmail Metrics. Functionally, it reviews Gmail and outputs statistics and analytical information about the associated account. Gmail Metrics is an easy and intuitive tool with complex internal structures and expansive functionality. Users install this add-on to an email box, and then it reviews the account and prepares analytical reports for the user. This proved a challenging, but interesting case for our team, creating Gmail Metrics and all the nuances of the web app’s many functions.

Magora: Brief
Solution

The result of the work, Gmail Metrics, performs many different functions, all associated with statistics and analytics of email traffic. Employees or managers can receive status reports for any period with exact figures and graphs and use a specialised viewer to monitor and analyse all its work, to draw conclusions and to streamline the working process.         

Magora’s experts have created a unified business tool which collects a large number of metrics and statistics for email reporting. Gmail Metrics is positioning itself to become an indispensable element of corporate email systems, as our app offers a complete picture to asses your own and your team’s work, analyse all this information and optimise the email communication process.

Multifeature Web App Interface Design

Statistics can be daunting, but it is still a very important science for increasing your own profits, because an understanding of data allows you to find and squash errors. Magora’s developers considered all customers wishes when building Gmail Metrics, and we have bolstered the web app with rich functionality, such as:

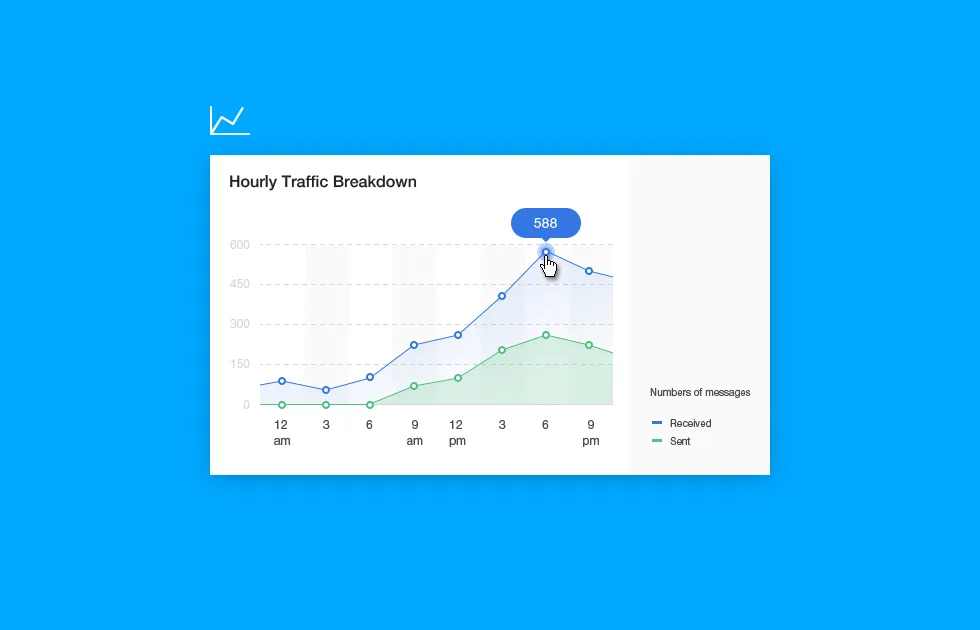
  • Traffic Monitor. The program can generate reports for one day, one week or one month, sorting and counting your incoming and sent messages on unique addresses, while also calculating the total number of conversations. Detailed statistical analysis is then presented in charts and graphs. Through these, you can identify traffic patterns, where you can see the quantity of email activity for a given period and learn what time of the day you usually send and receive the largest amount of important correspondence.       
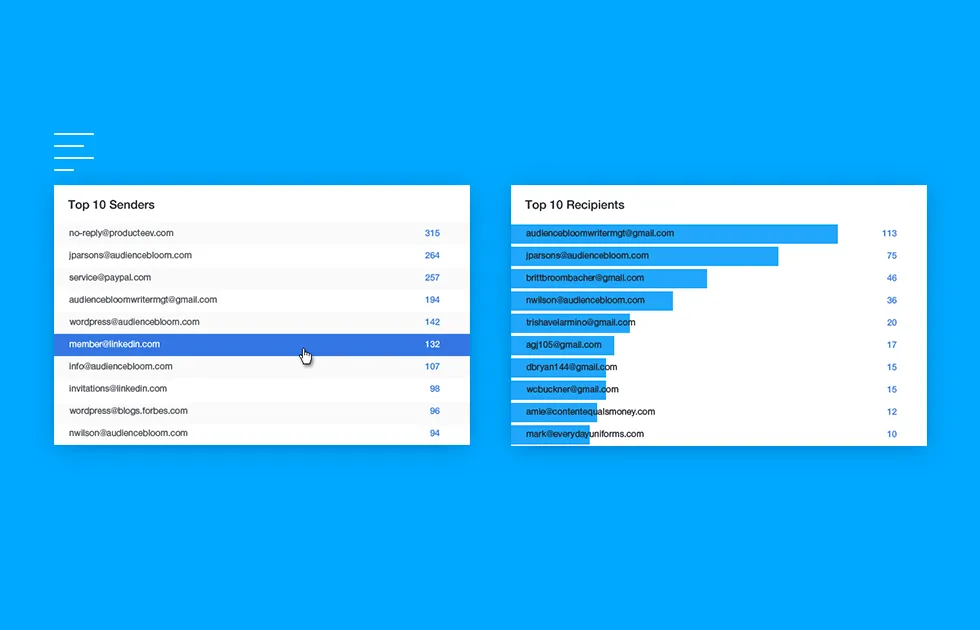
  • Top Senders/Recipients and Top Email Thread. This graph covers the most important respondents with whom you keep in touch.  
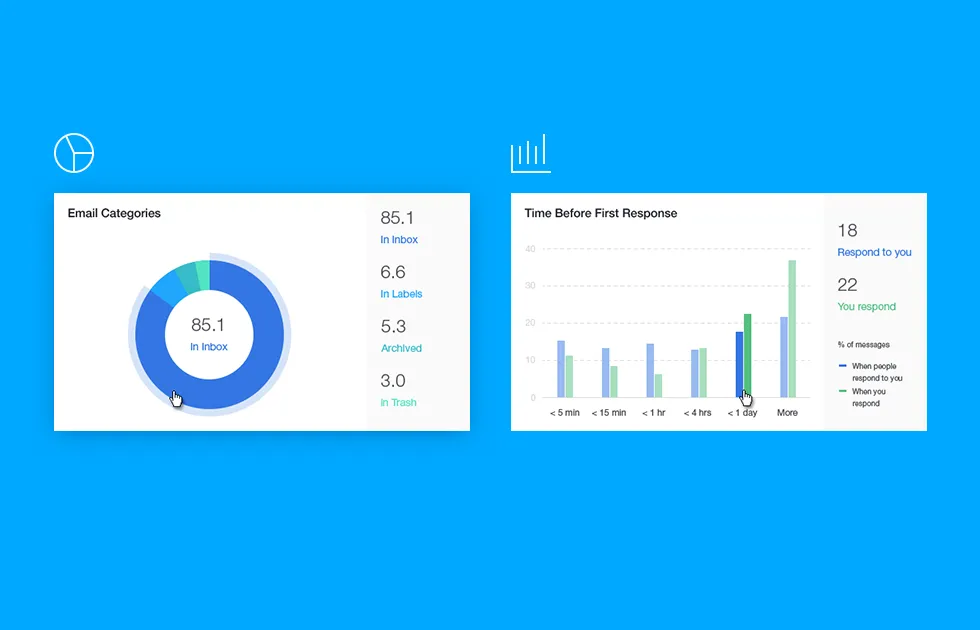
  • Email categories. This graph illustrates how you organise your inbox by categorising the way you move emails into different places, label correspondence, archive messages, delete correspondence, and so on.   
  • Word Count and Thread Length. The Gmail Metrics web app calculates the average number of words in your messages. This graph shows you how often you enter into lengthy email negotiations and how many of your letters are shorter than 50 words.   
  • First Response and Average Response Times. Users can take advantage of this feature to determine how much time staff spends answering initial messages, and how quickly they answer throughout a conversation.
  • Number of Attachments. This web application counts the number of attached files which have been sent or opened and sorts them into groups.  
  • Daily Email Volume. This graph charts each day's email volume in fifteen minute increments, so you can view daily email traffic over the course of any single day.
  • Average Words per Minute. Monitor your text input speeds and cross reference those against response times to identify potential delays.
  • Average Email Time. This set of statistics measures both writing and reading time to calculate just how much time you spend handling your email.

Six members of Magora’s team worked on this task for more than 1700 hours, and the program has been presented to the client. The main difficulties surrounded the creation of the many various graphs of different types. Most Chartist.js functions of data visualization did not match our client’s requirements, so we needed to develop an additional layer to the app, expanding its library functions and simplifying its usage with React.js. In addition to that, we developed several plugins, and perfecting the user-friendly interface and cross-browser compatibility surrounding such complex data sets was a very time-consuming process. Yet, despite all the difficulties, Magora’s engineers were able to provide our customer the business tool he dreamed about: Gmail Metrics.

Magora: Solution
Result

Gmail Metrics is a supportive business web app and it’s ready to improve your efficiency on 15-20% through competent time management analysis. Because of the program’s ease-of-use and its extensive graphical displays, you can monitor email statistics and review traffic, organise your team’s workflow properly, address issues and maximise time efficiency. The Gmail Metrics web app puts important details in your inbox and lets you organise your work flow more coherently. Our project allows you to concentrate on the really important business tasks.

Magora’s developers believe this program will help business owners to work, to observe corporative email and to draw conclusions about their communications. They envisioned and delivered a clear, customised system that matches our client’s specific needs. Managers can monitor their staff’s email statistics and traffic, and then they can compare the efforts of different offices. In turn, employees can use this data to improve the efficiency of their own work. Our customer is very pleased with the results, because Gmail Metrics is the exact type of web tool for increasing productivity he had sought our help in developing.       

Magora: Result
Logo Magora LTD
close
Get in touch
Logo Magora LTD
close
Thank you very much.

Your registration to the webinar on the 27th of September at 2 p.m. BST was successfuly completed.
We will send you a reminder on the day before the event.
Magora team
Registration for a webinar

"Let Smart Bots Speed up your Business"
Date: 27.09.2018 Time: 2 p.m. BST
Do you agree to the personal data processing?