Customers are different, therefore their demands differ as well. One of our clients had set us with a task to create a good-looking animated bubble chart
Customers are different, therefore their demands differ as well. One of our clients had set us with a task to create a good-looking animated bubble chart capable to regroup. So, let’s talk about it.How it all began
It all began as it is supposed to – with a Technical Specification. It was sufficient enough to start working right away. It included a description of page business logics as a whole and information about the parameters responsible for grouping or filtering bubbles and other important details. Also they attached an example we could use to build bubbles’ logics and physics.Let’s start
Looking through the source code of an existing page seemed a bit too complicated, so we found a source with a simple description of bubbles’ physics. I’d have to say that for someone, who just started working with D3’s Force Layout concepts like friction, charge, gravity might seem complicated. Even the official site states that those names are “perhaps misleading”. And it’s true! Here’s a brief description of the parameters:friction is a parameter responsible for DOM node acceleration. For example, if the value of a parameter equals 1, acceleration will be almost instant – a node will go from A to B in a flash. If the value is between 0 and 1, node motion will take some time. In case the parameter value equals 0, a node will freeze and won’t go anywhere.
charge is a parameter defining the force of node attraction/repulsion from each other. From personal experience I can tell you, that it’s a useful parameter for simple cases, but in our situation it became a stumbling block. But this is a topic for later.
gravity is a parameter that determines the attraction/repulsion of nodes from the centre.
I’m not going to reinvent the wheel, as the library author’s blog has many examples of using these forces. Here’s a short description:
1) To create a "force" just declare it and set sizes:
this._force = d3.layout.force();
this._force.size([width, height]);
All other parameters will be determined automatically
2) To add nodes to it you’ll need to use the “nodes” method:this._force.nodes(data);Data is an array of objects containing node parameters. An object can contain any fields, but some field names are used as initial values of the “force”. In order to make the “force” move the nodes the way we want it to, we need to determine the “tick” event handler. It reacts to every “frame” of the force and allows to calculate the next position of a node. That’s where the magic begins… We’ll talk about it later. The force can be activated with the help of “start” method:
this._force.start();Use of this method “brings our force to life”.
Processing force “frame”
As mentioned above, the “tick” event handler is a place where the magic happens – calculation of node parameters. In our case, a bubble has 4 parameters:Horizontal position
Vertical position
Radius
Color
It seems to be working, what’s next?
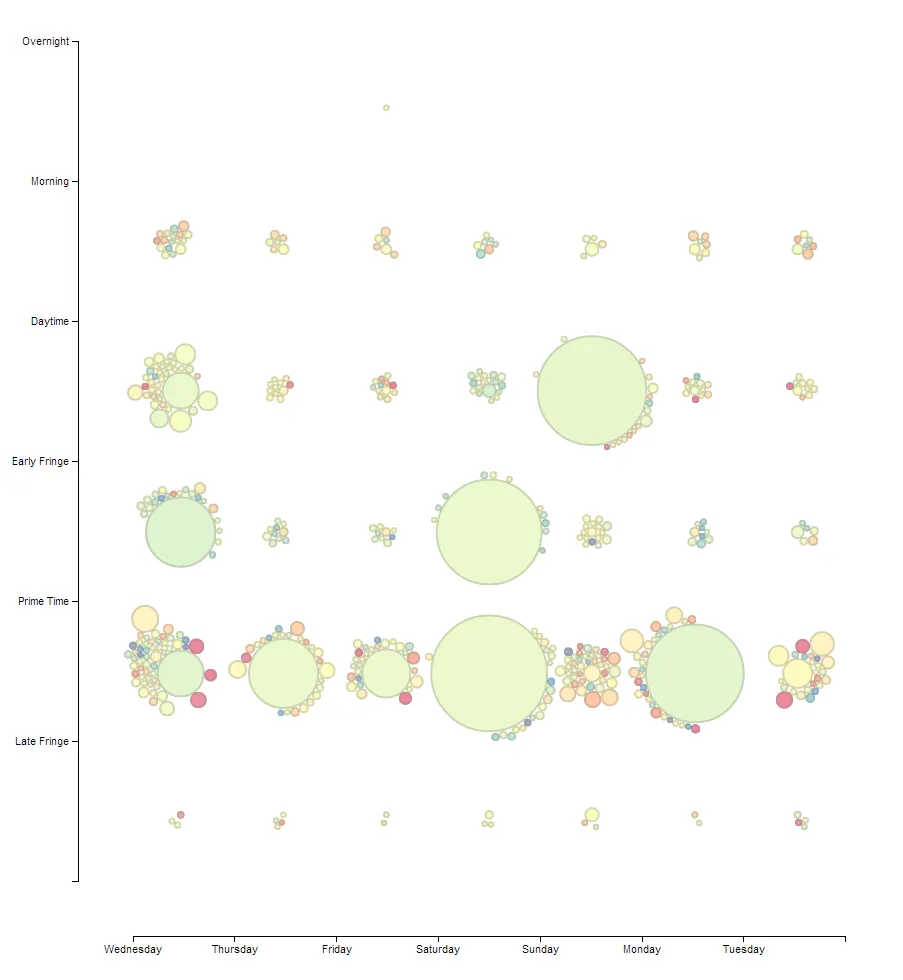
We’ve implemented the approach, described in the guide I’ve mentioned above. Everything works as supposed to, all of the bubbles spread and flow beautifully, and they bypass each other, stop at their places… But something’s not right… If you look at a live example from the article, you’ll see that even though the groups have different centres, bubbles themselves interact with each other no matter which group they belong. This creates a common force that pushes groups from each other. In the example from the article there are only 3 groups, but in our case there were 7 of them. Trust me, it looked dreadful: at times a group of bubbles were repulsed by other groups to a distance of 1,5-2 scale divisions. It confused a user, forcing him to calculate how far the necessary group was from the central one, if there had been one.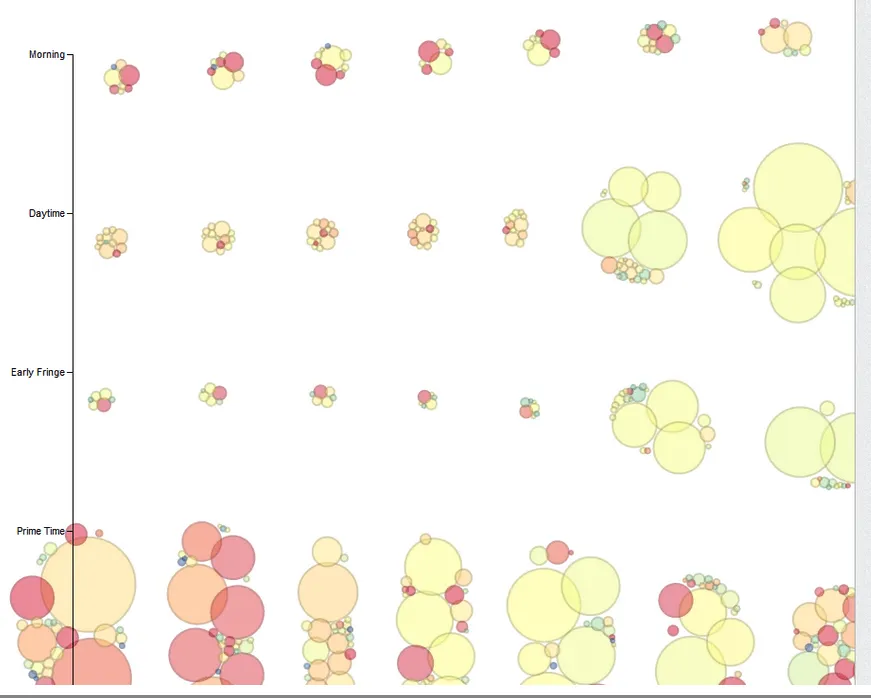 As expected, the solution has been found at the library author’s blog. In this situation he doesn’t use a standard function to calculate particle interaction, setting “0” value for the charge parameter. Instead, he splits nodes up into clusters, and every node knows which cluster it belongs to. Based on this, the force of interaction is only calculated for nodes pertaining to one cluster.
In our case, it’s been decided that a bubble with the largest diameter in a group will become central, and all other bubbles of a group will follow it. This way, if a bubble is the leading one, it’ll be necessary to determine only its next position, but not the interaction with other bubbles of a group. Otherwise a group won’t get to a final point.
As expected, the solution has been found at the library author’s blog. In this situation he doesn’t use a standard function to calculate particle interaction, setting “0” value for the charge parameter. Instead, he splits nodes up into clusters, and every node knows which cluster it belongs to. Based on this, the force of interaction is only calculated for nodes pertaining to one cluster.
In our case, it’s been decided that a bubble with the largest diameter in a group will become central, and all other bubbles of a group will follow it. This way, if a bubble is the leading one, it’ll be necessary to determine only its next position, but not the interaction with other bubbles of a group. Otherwise a group won’t get to a final point.
Conclusion
Adding a complete component code here is not appropriate, as everyone has specific tasks, plus there is also a thing called “code confidentiality policy”. Hopefully, I came through with the general idea and explained dealing with the issues during the development process. Maybe this article will help someone to create a similar component faster.
Artem Efremov
Meet Artem, the dynamic force behind Magora's Development team and the success of our clients' projects. With a genuine passion for technology and a deep understanding of his team's strengths, Artem fosters a collaborative environment where creativity flourishes. His dedication to excellence and personal touch ensure that every project exceeds expectations, leaving a lasting impact on both clients and colleagues alike.
LinkedIn