Who are you, Digital Dashboard? Let’s begin by figuring out the defining characteristics of Dashboards. In informational systems a Digital Dashboard is usually
Who are you, Digital Dashboard?
Let’s begin by figuring out the defining characteristics of Dashboards. In informational systems a Digital Dashboard is usually a single page that:
- Contains plain and easy to understand data;
- Includes a real-time UI;
- Is integrated with a database for dynamic updating;
- Features graphic elements that reveal the change of key indicators and current trends of the system.
Data presented might relate to pretty much anything and is specified by the particularity of a system or an organization.
A bit of history
The original idea of Digital Dashboards emerged from the study of Decision Support Systems (DSS) that appeared in the 1970s. But dashboards as we now know them didn’t start to appear until during the late 90s – at the time of increasing growth of the web. The first pieces of software were created in-house for internal use only. Microsoft came up with their own concept in the spring of 1999. The actual implementation of the concept was the Digital Dashboard Starter Kit, which they presented at the KMWorld'99 later in September.
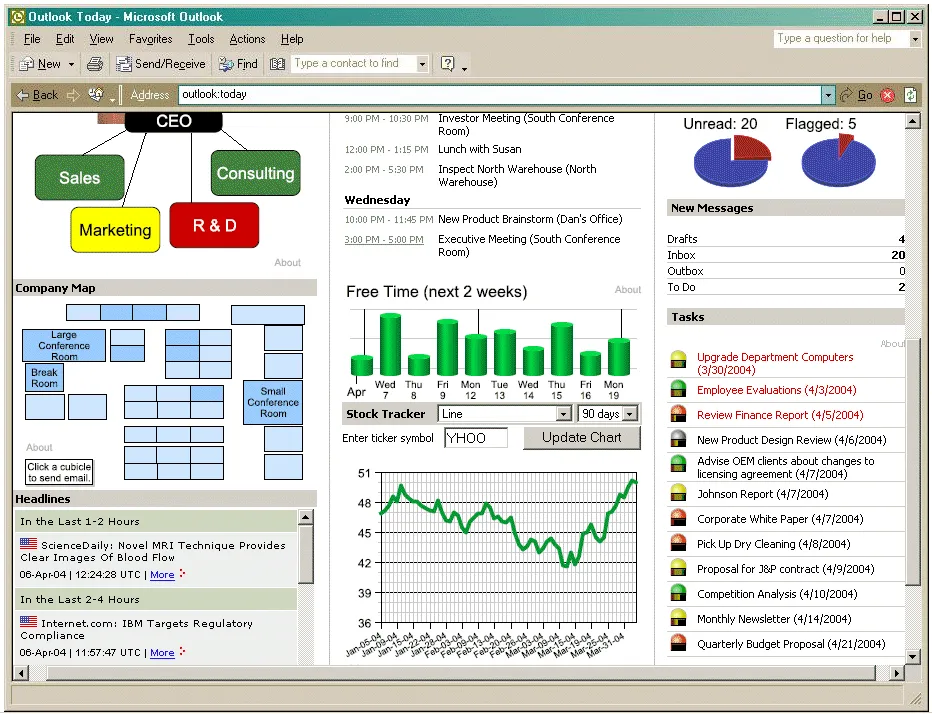
This is the Digital Dashboard made by Corda Technologies that was integrated in MS Outlook. As of October 2010 the company was acquired by Domo, Inc – an organization that specializes in data visualization.
Modern Digital Dashboards
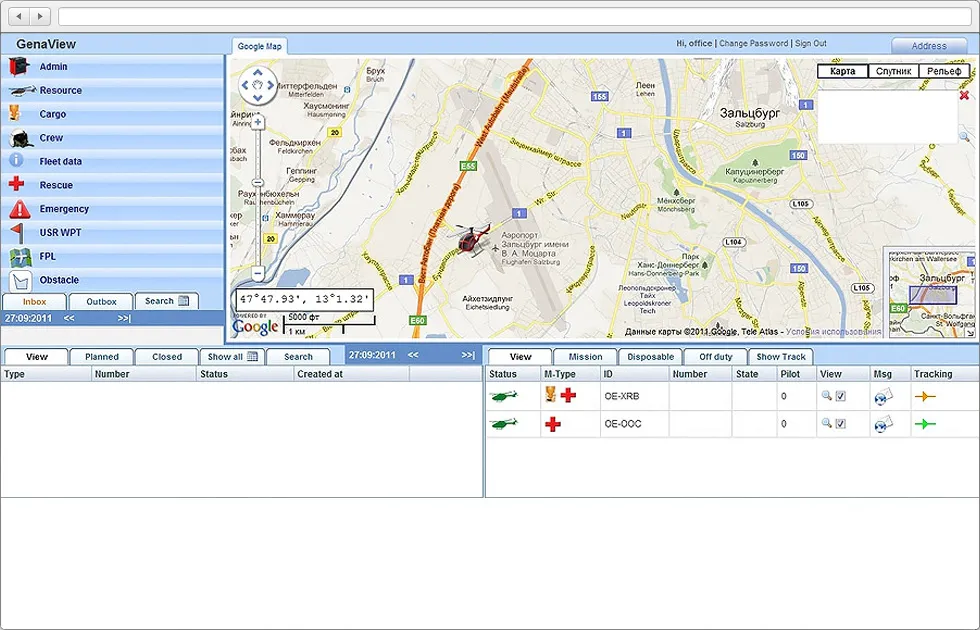
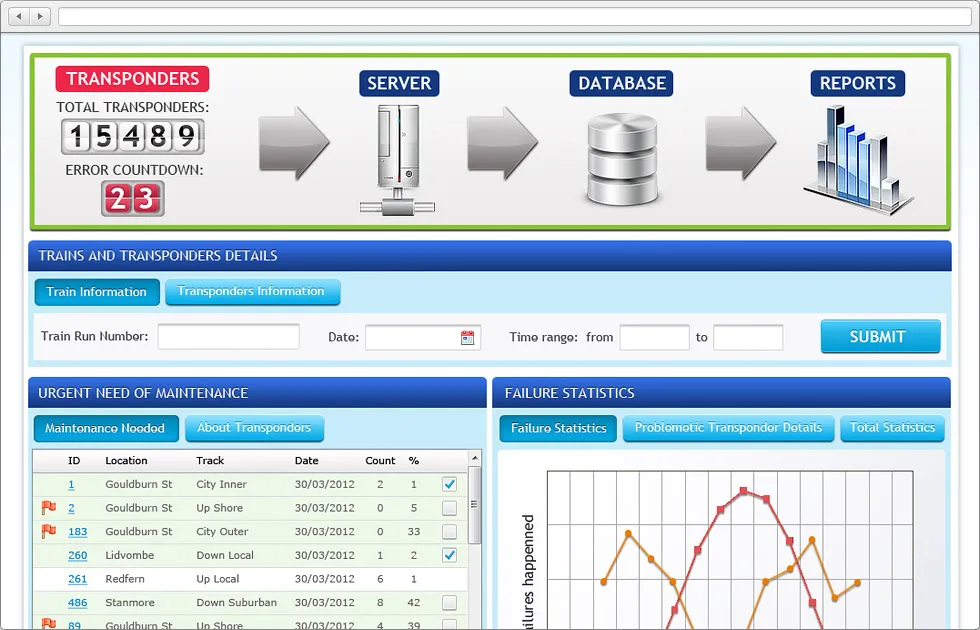
Today if you stumble upon a Digital Dashboard, it will most likely be one of these three types: special applications, web apps and desktop widgets. Just like a dashboard in a car, a digital version is meant for monitoring all major indexes. That’s what all these indicators, diagrams, numbers and designations are for. These days Dashboards can be visually stunning. But the major focus would still have to be on the contents. Thus, the key to designing a perfect dashboard is the cold-blooded calculation. If you’re able to put all the dots together within one brief look, then you’re looking at a great Dashboard. Don’t forget to make it pretty, though, and try to achieve maximal effect with minimal effort.
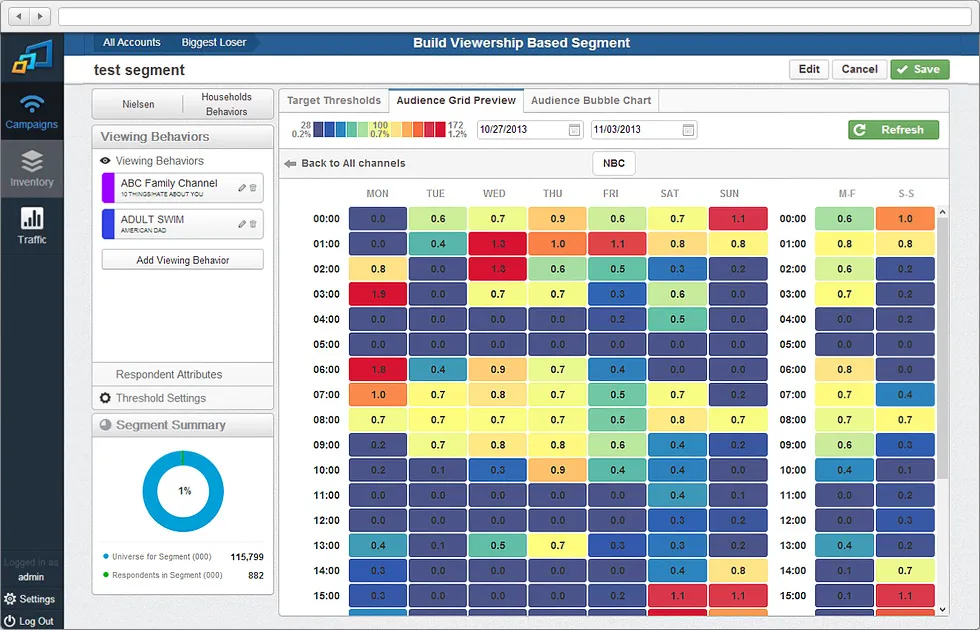
Here are some examples of current Dashboards:
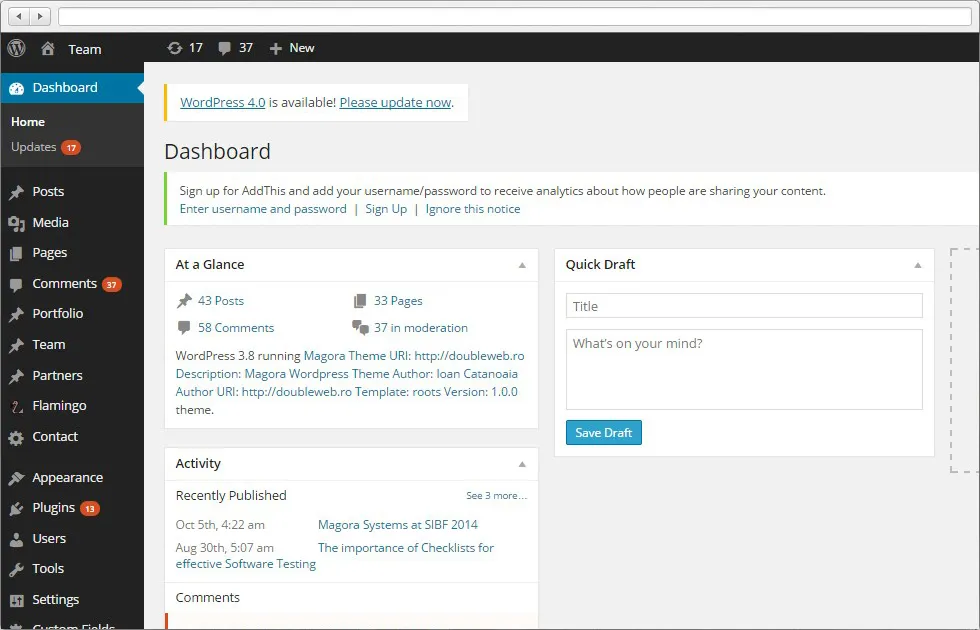
- WordPress CMS Dashboard:
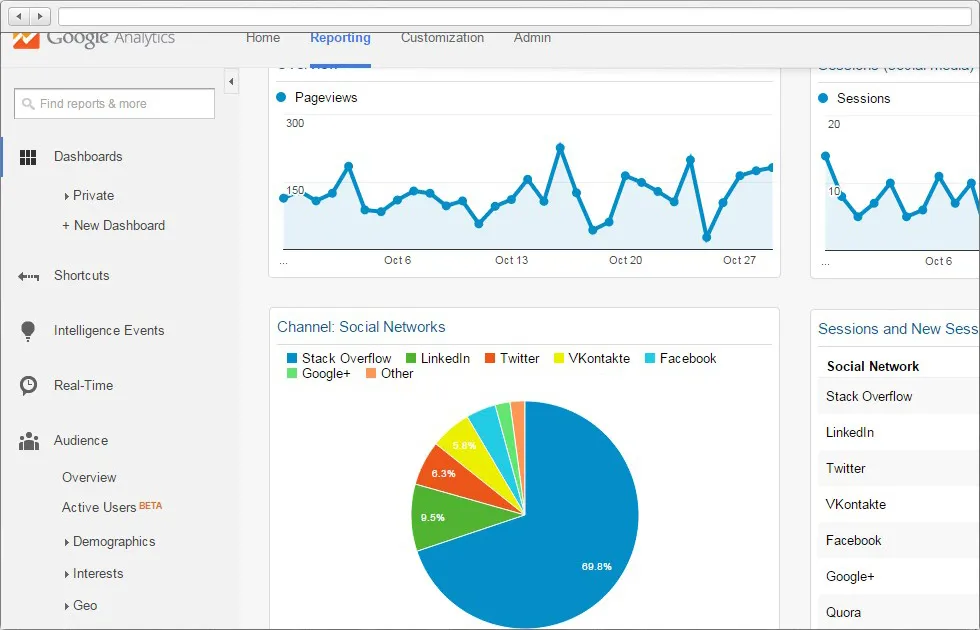
- Google Analytics Dashboard:
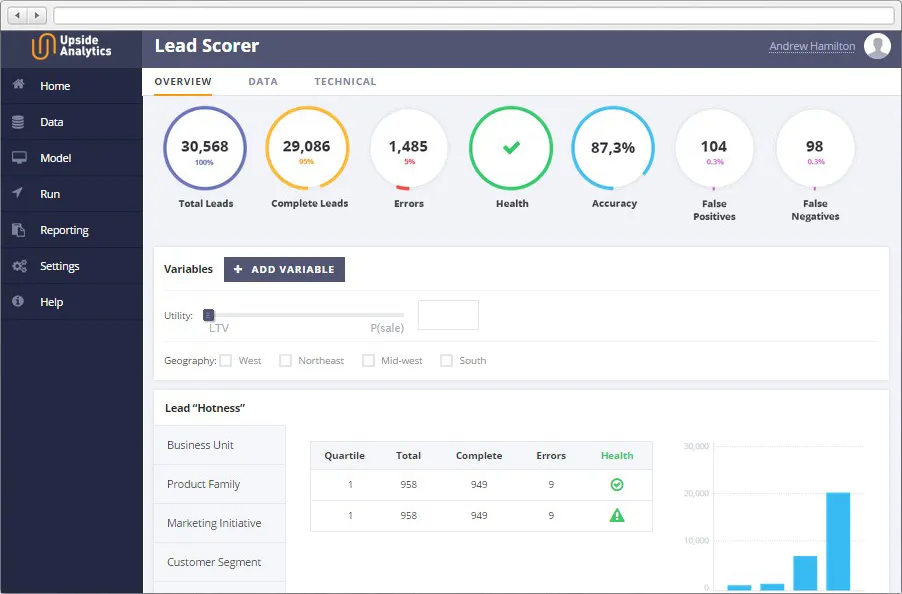
Magora have first-hand experience and capability to create thought through spectacular digital dashboards. Take a look at some solid examples of our work:
- U Analytics
- Advanta
Why dashboards?
“He who controls the information controls the world”.
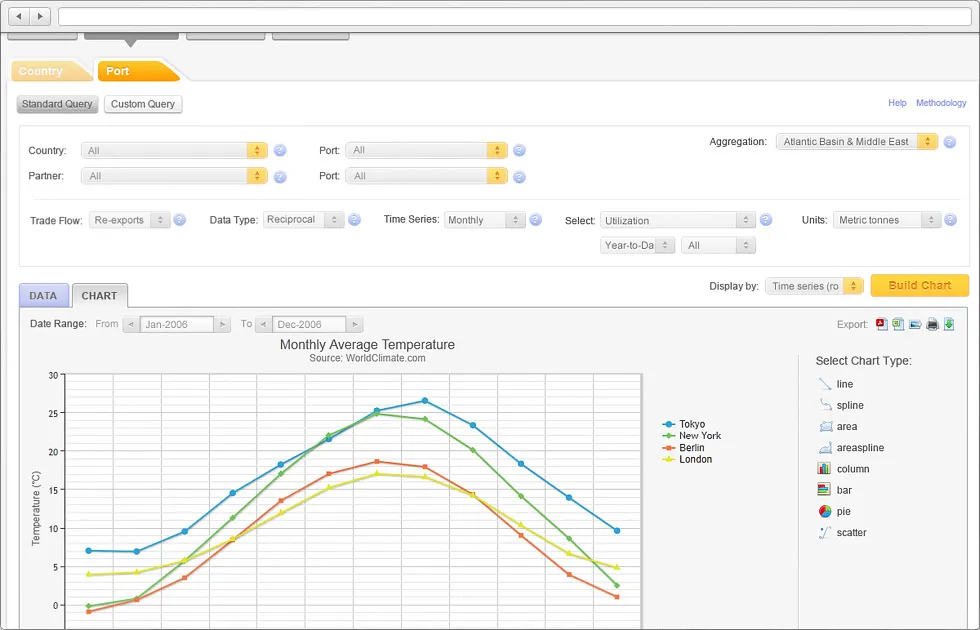
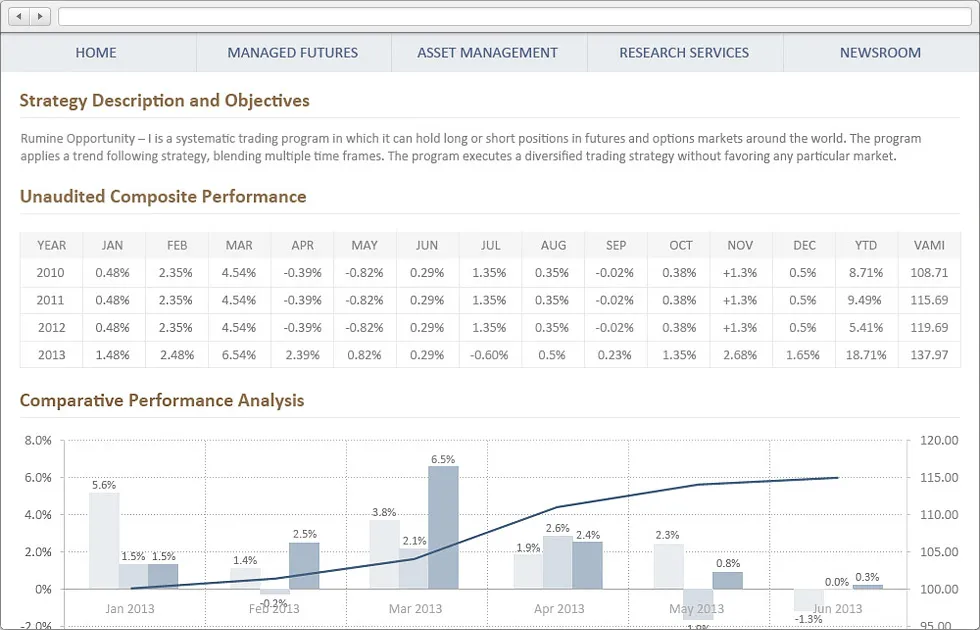
As you probably know, information is an economic resource. And it’s the one that becomes more and more influential each day. So, the answer is quite simple: dashboards provide valuable insight, help organize data, analyse it in a flash and make smart decisions. And all of these great advantages are packed into a single interactive page. Good stuff, right? You’ll be in on everything that goes down in your company. Dashboards might include many things: from HR department stats to sales dynamics, production indexes and customer service quality evaluation. Having a dashboard will allow you to get a hold of consolidated data concerning the company as a whole and evaluate the input of each division as well. In order to create a perfect dashboard, you need to pay extra special attention to the choice of key indexes and the appropriate form of data representation: tables, histograms, pie charts, bar charts, sparklines or something else.
To sum up let’s make a list of the most valuable advantages that dashboards can bring to the table:
-
Data visualization – numbers are turned into graphs and diagrams, everything is sorted and grouped;
-
Quickly track negative trends and fix them;
-
Generate even the most complex report in a blink of an eye;
-
It’s easy to spot correlations or deviations from the norm;
-
Get a bird’s eye view of all organizational affairs;
-
Dashboards help tremendously with the decision-making process. The management can make instant yet smart choices as they can access information of any level quickly;
-
Build a clear strategy and set functional goals accordingly.
You can opt for a turnkey solution. You can go with a custom-made dashboard. Follow the concept, collect and analyse your data and make a smart choice for your business!

Alexander Bessudnov
Alexander is an accomplished Chief Product Owner with a proven track record of leading successful product development initiatives at Magora. With a passion for innovation and a keen understanding of market trends, Alexander plays a pivotal role in shaping Magora's product strategy and ensuring the delivery of cutting-edge solutions to clients.
LinkedIn