Discover here how to use Big Data technology to optimise your business processes and generate higher income.
What is Big Data?
‘Big data’ refers to large volumes of information, both structured and unstructured, that should, in theory, be very difficult to analyse but are now easily processed with the help of specialist computer programs based on machine-learning techniques.
At first, it served simply as material for interesting scientific experiments. The next step was the development of artificial companions in computer games. Now, big data analysis helps to uncover similarities in chunks of data so massive that they have nothing in common from a human point of view.
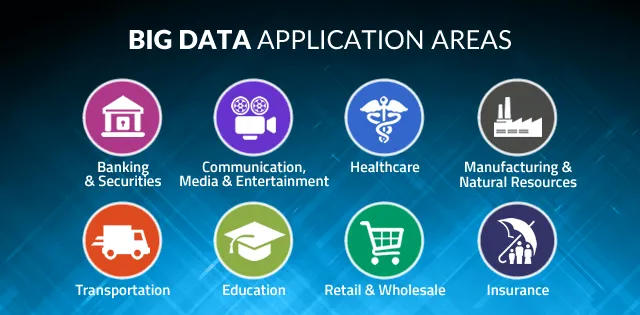
- Clustering, trends and behaviour patterns are elicited effectively in order to support decision-making in finance and logistics, healthcare and production management, real estate and construction.
Some examples:
To look at big data in the context of business, let’s think of an online store which has traffic in the thousands of customers per day. Every second new visitors arrive and each of them implements dozens of operations.
- In order to forecast their potential requirements, we must collect data about demographics, tastes, preferences and behaviour, adding to the analysed data the visitors’ searches on other platforms and activities on social networks and clustering them based on their similarities.
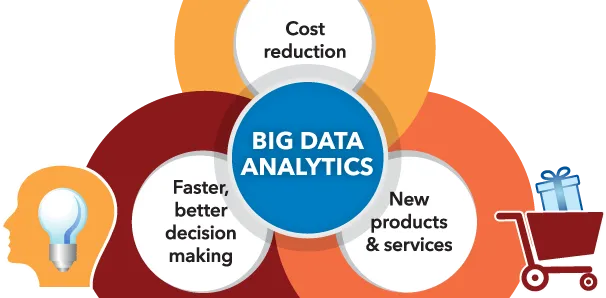
Analysing such data helps to better understand the needs of customers and create personalised offers. This, in turn, increases conversion and raises sales volumes.
Operational Analytics
There are two main division of analysis: industrial data analytics and business process analytics. Depending on your goals, we’ll take one of the approaches to support your decisions with valuable researches.
Practical Application of Industrial Big Data Analytics
Analysis of industrial data sets allows companies to:
- identify, measure and manage the risks associated with equipment downtime;
- detect the pre-failure condition of machines;
- spot damaged goods instantly thanks to real-time analysis;
- optimise asset management, predict potential failures and practice proactive maintenance;
- regulate the use of facilities;
- improve the quality of products/services.
Application of Business Process Analytics
Customer analytics
Facts such as buyers’ preferable assortment, frequency of purchases and user preferences and habits can be corroborated by different sources and aggregated in a tailor-made, convenient-to-use piece of software.
Based on these results, you can:
- decipher customer behaviour;
- segment your target audience;
- create personalised offers;
- optimise the assortment and services according to the needs of the buyers’ segments;
- plan marketing campaigns and increase your conversion rate;
- increase sales volumes and customer loyalty.
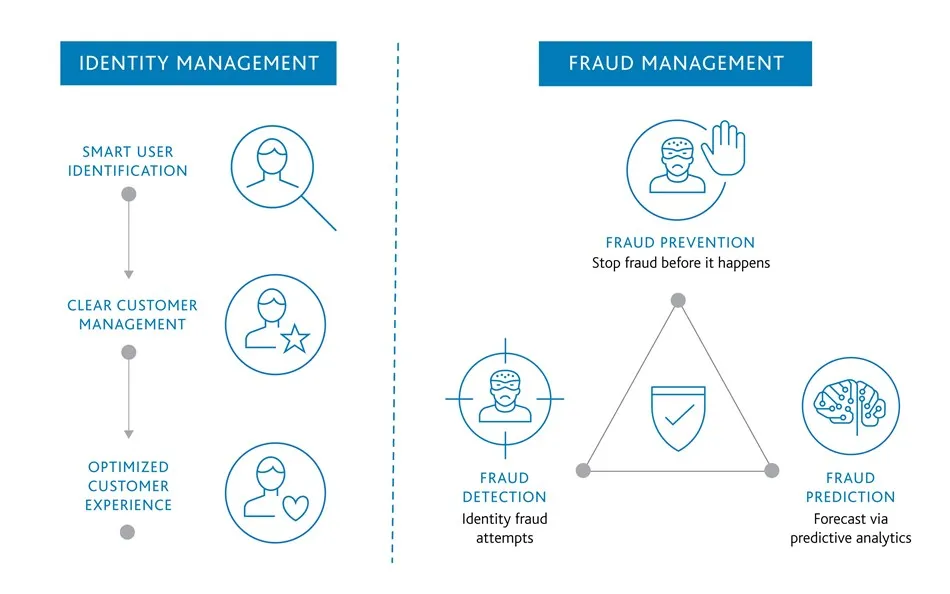
Big Data implementation for fraud prevention
The use of analytics helps identify suspicious activities and prevent potential fraud. This technology has long been used in banks to analyse borrowers’ profiles. Read more about it here.
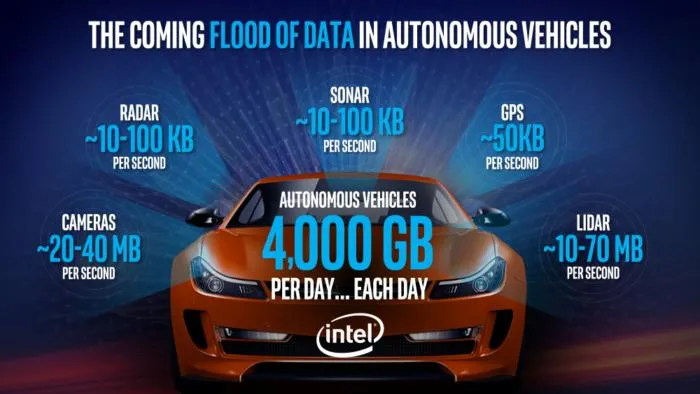
Driverless car development
Several automotive companies, including Tesla, Mercedes and Volvo, are working on the development of driverless cars. Some components of automatic parking assistants use big data analysis to make their decisions as to what route should be implemented in each case.
Google algorithm updates
One example of constant optimisation via the use of big data analysis is the changing of how Google search engines work. Some minor improvements are implemented on a daily basis, with the more major upgrades even getting personal names such as Pigeon, Panda or Florida.
Our experts in Big Data consulting will help you study the available information about your current and potential clients, regardless of whether they’ve visited an online store or a corporate website, used the company's mobile application or left comments on social networks.
Below you’ll see an explanation of some important attributes with which you should be familiar in order to understand to what extent you can delegate your decision-making processes to big data analysis output.
The Three Vs approach to big data
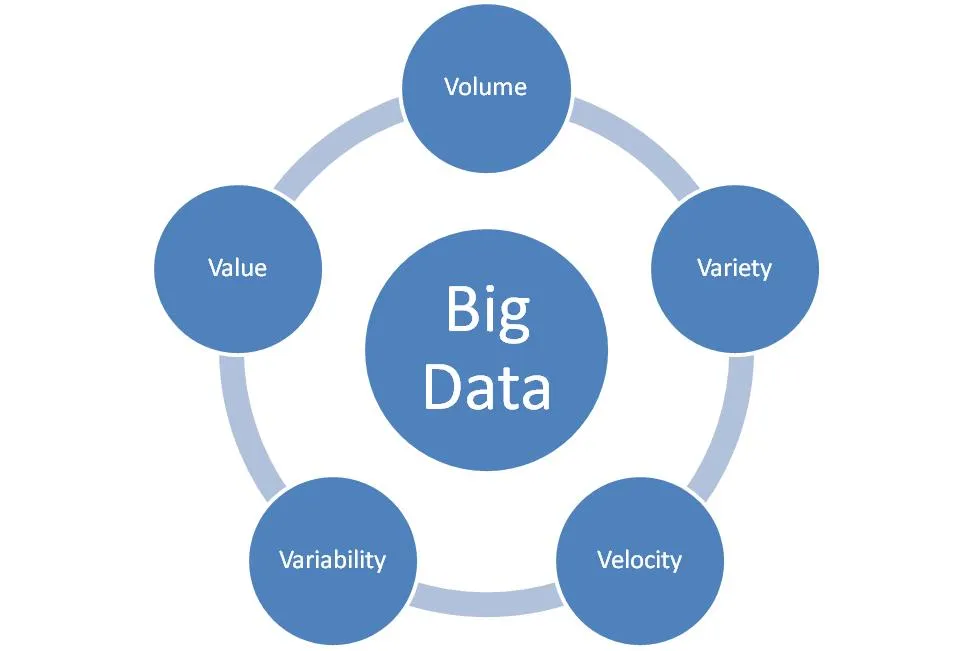
Big Data has some attributes that are usually referred to as the Three Vs approach. They are:
- Volume: this describes how much data is stored;
For the realisation of concrete tasks we have to operate with a minimal representative set of data, below which inaccuracies are high and data cannot be assessed as reliable.
Example: Two customers' preferences cannot be considered a proper sample for analysis of your buyers’ preferences. The same goes for big data – in order to analyse several factors we have to work with a very large set of data.
- Variety: this shows what types of data – structured or unstructured – you have.
Example: Structured data is a variety which can be ordered by some sort of rule; unstructured is something that appears to be total chaos – like tweets and SMS in your phone compared with the money in your pocket.
- Velocity refers to how fast the data comes in and how often it is updated.
Example: each of the tasks demands its own updates. If you’re working with smartphone sales, analysis of the users’ wishes based on three-year data will lead us nowhere. The opposite problem is the analysis of an Amazon transaction.
To provide the data valuable for decision-making, we need to discuss to what extent we can take velocity into account.
This initial set represents the basis of big data analysis architecture. Quite often one more factor is added – Variability. In this case, the set is called 4V.
- Variability focuses on the inconsistency of the data.
Variability is important because it can have a significant influence on the results – like a couple of very expensive purchases change the average of your buyers’ daily bills.
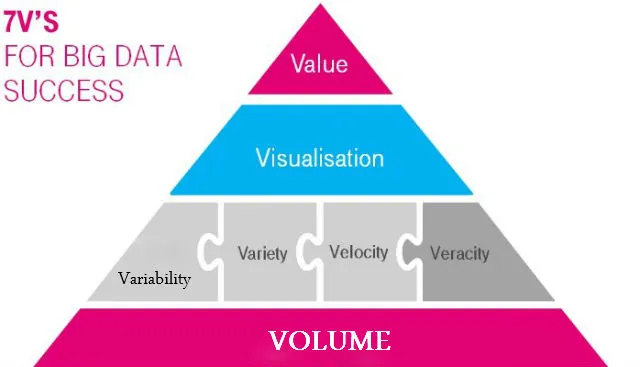
Here are some more attributes that are often mentioned in Big Data:
-
Veracity. This describes the reliability of the data to be analysed. The more data is generated, the higher the risk of “dirty” info or inherent discrepancies in all the data collected.
-
Value. If your intention is to find the deviation of blue-eyed cats on YouTube, it’s not so important whether you’ve collected all the cats’ videos or are working with a representative sample. But if we’re working with disease forecasting, the cost of mistakes is very high and we have to collect all the data, even if an additional set needs much more investment.
-
Complexity. It doesn’t start with a V, but still. It’s kind of similar to Variety, but refers only to the format of the data, which can be very difficult to analyse. Moreover, the cost of the analysis can surpass the business value of the potential results.
So, sometimes the 3 Vs approach transforms into 4 Vs, 6 Vs or 10 Vs. Here is a more comprehensive list of different Vs.
How we work with big data
We help our clients not to get lost among the many options: choose a cloud or server solution, platform or framework capable of solving the tasks with the help of Big Data analysis. We design software based on your enterprise demands, evaluating all the pros and cons of each of the approaches and helping you choose the best option.
- With the help of machine learning (one of the methods of big data analysis), you can divide your potential customers into groups with conformal characteristics and collect supportive scientific facts about their behaviour forecasting.
To work with Big Data, our team uses a broad technology stack, including such frameworks as Apache Hadoop, Apache Spark, Apache Storm, Apache Cassandra etc.
Our programmer team will implement a convenient solution to let you structure the chaotic masses of data into clear visual trends to increase efficiency and ROI.
Get in touch with us
Contact our experts to find out how to get the most from Big Data in cooperation with Magora.

Alex Galaktionov
A seasoned technology expert and agile advocate, Alexey brings over a decade of transformative expertise in the IT sector guiding startups through effective fundraising strategies, tech innovation and development methodologies for groundbreaking products.
LinkedIn