Read this post on four types of data analytics and increase your efficiency with the help of modern IT techniques.
We begin our series of publication about Big Data with an explanation of some basic principles. In this post, we’ll take a look at types of data analysis that can be implemented for your benefit.
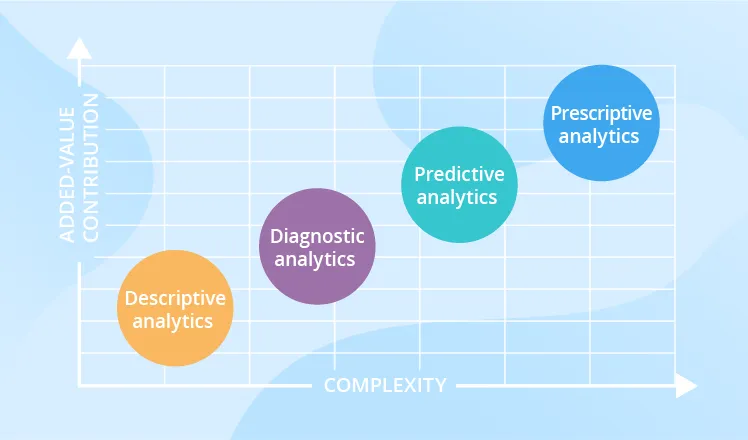
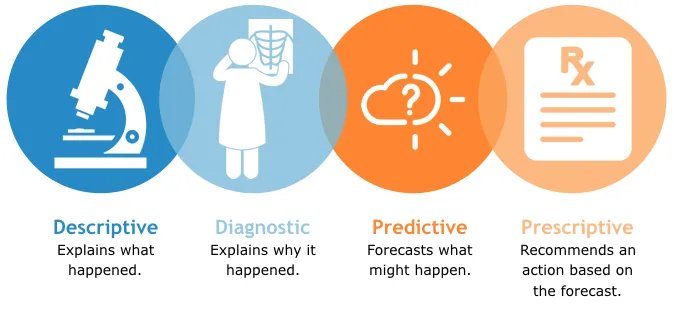
Descriptive Analytics
These describe what has already happened.
- For example, a retailer can learn the number of clients, the average bill, the most popular goods, etc.
- A medical company can evaluate the most common illnesses and susceptibility to disease.
- Governments can stimulate population growth by organising additional social support for families with several children if the overall number of pregnant women has been decreasing over several consistent years.
With the help of descriptive analysis, any company is able to group its customers by social factors, behaviour and other features, as well as monitoring peak activities according to seasonal or local factors.
Descriptive analytics manipulates figures from multiple data sources to provide valuable information about the past. So, developers can predict important trends and signal the necessity of preventative or stimulative actions.
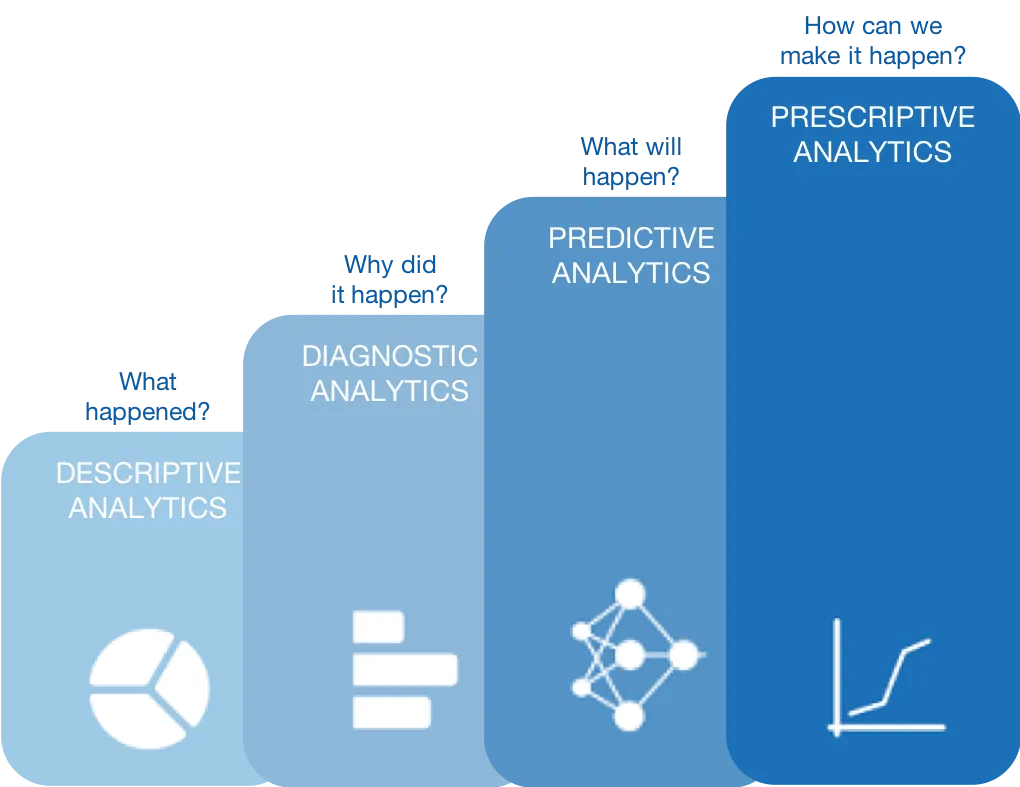
Diagnostic analytics
This type doesn’t simply state but aims to find the reason behind why something happened. We use it to identify the patterns and consequences of our policies and actions. It provides a deeper understanding of any given problem.
- In IT, for this purpose, we use business intelligence (BI), to be more specific - it’s machine learning technics again. These are computer-based methods of analysing and reporting valuable information. For example, using ML in healthcare, medics can diagnose a person’s susceptibility to cancer-based on medical screenings.
Predictive analytics
Predictive analytics address what might happen.
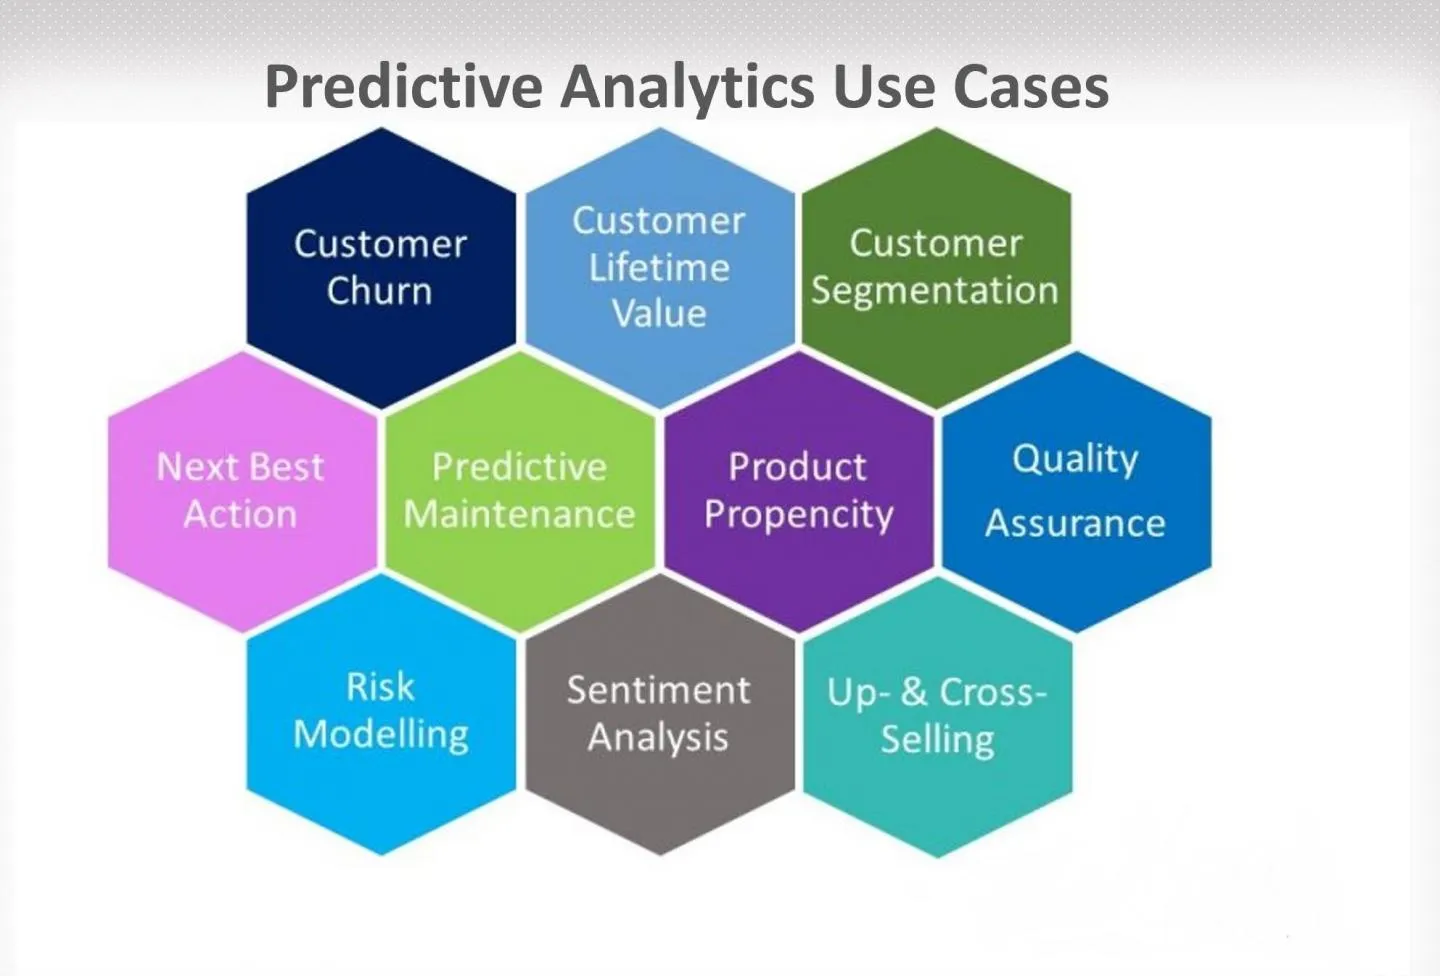
To be able to predict trends and see into the future, this type of analytics uses the results of the previous two – i.e. it bases its results on true facts of the past.
- With the help of the predictive analysis, an entrepreneur can optimise the raw material storage and the warehouse stock. Computer systems predict stock exchanges, market fluctuations and currency exchange rates. This is specifically useful in finance, production, logistics and banking.
However, it’s important to understand that all the results this type of analytics provides you with are approximate. The accuracy of data and the stability of the situation have a significant influence on the result. It requires careful processing and constant optimisation.
Combining the approaches gives the best, most relevant results.
Prescriptive analytics
Prescriptive analysis is based on mathematical modelling. Its mission is to show the consequences of certain actions based on possible changes to data and conditions.
When is it time to use prescriptive analysis?
- Prescriptive analytics is a branch with a high degree of responsibility: it utilises top-notch tools and technologies, such as machine learning and data mining.
- It helps in decision-making by constructing a potential future and estimating the probability and extent of any given factor’s influence. (Remember “Back to the Future” – they were realising the prescriptive analysis in a series of events).
- It’s complicated and expensive. If you are working with vital factors, it lets you save much more than you spend. But for some cases, it’s worth to use mathematical modelling and statistical analysis to get value for money solution.
Predictive vs prescriptive analytics – what’s the difference?
Predictive analytics help to collect the figures needed for informed decision-making, while prescriptive analysis constructs different solutions for you to choose from.
Which approach to analysis is the best?
To provide true-to-life results, the combination of all four methods is the best option. The wide variety of information sources and compilation of different mathematical approaches to interpretation increase the accuracy and value of the results.
Data analytics in a business context helps to better recognise the dependencies and cardinal processes and provide key points for improvement based on probability rather than pure intuition.
What analytical methods do companies choose?
We’ve collected several surveys to find out this fact.
McKinsey analytics
McKinsey has published an e-book dedicated to the state of data analysis as for 2018. They declare its increasing importance for improved customer satisfaction.
- For this, they call for the use of the figures provided by descriptive analytics and for combining it with external data analysis. This method can be applied to any aspect of a business from retail to design and marketing strategy building.
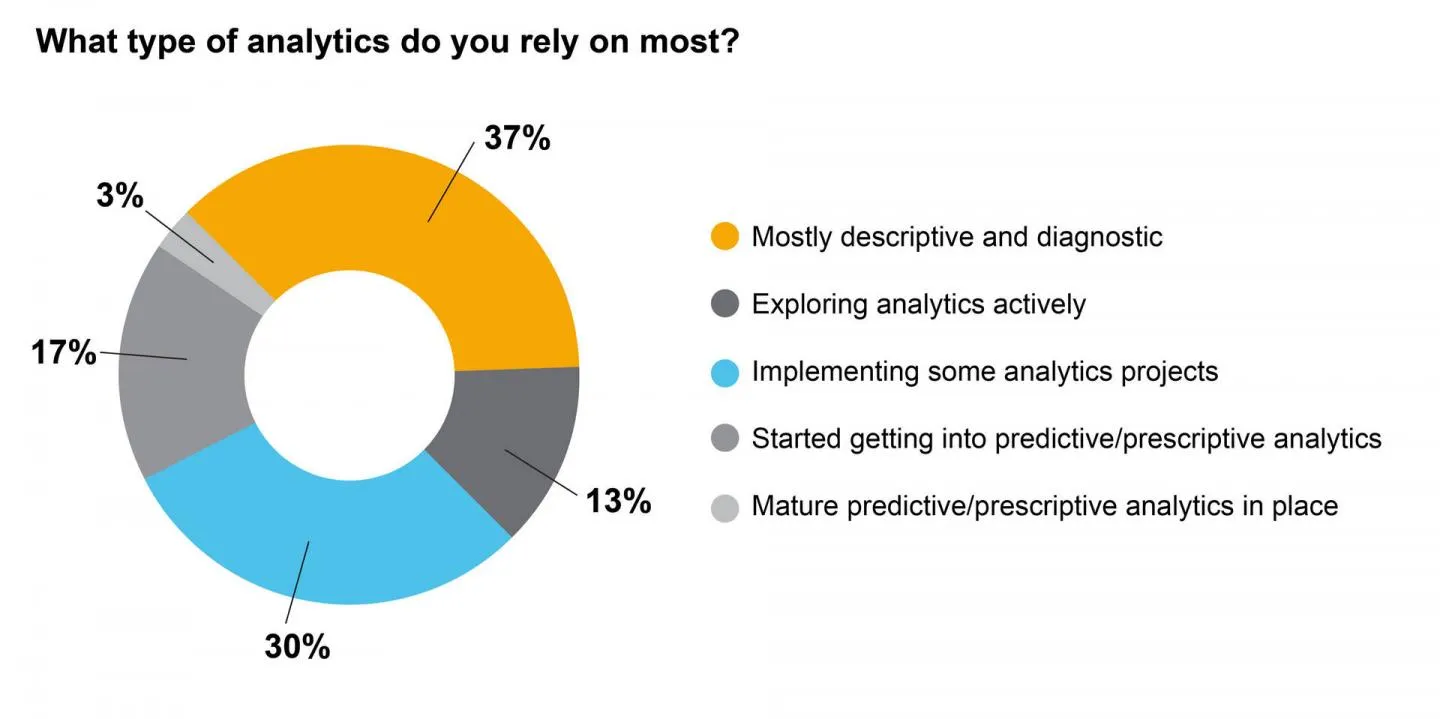
BI-survey.com
BI-survey website names the most important data analytics trends for 2019.
These are:
- Master data and data quality management. You can read more about these here;
- Data discovery, which is the process of discovering patterns and mechanisms in the datasets you’ve collected in order to benefit a business;
- Self-service BI. This is an approach to analytics that enables business users to access and work with corporate data even if they don’t have a background in statistical analysis, BI or data mining.
The trends that evidently enjoy greater importance this year are agile BI development and advanced analytics tools. The less popular ones are related to real-time analytics and mobile BI. They appear to be less practically valuable when compared with diagnostic analytics and predictive analytics.
Case studies: how large companies use data analytics
Here we share famous case studies of popular brands using big data analytics.
Get new customers and make them loyal to the brand: Coca-Cola
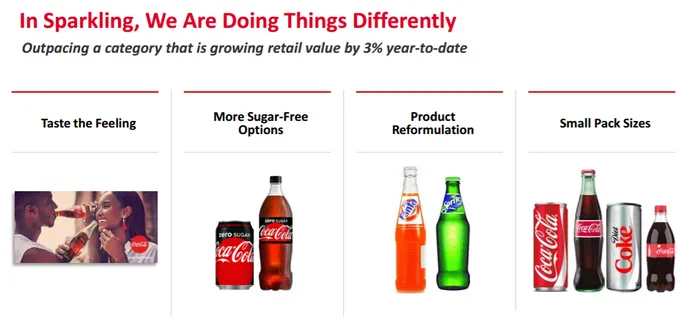
An interview with the company’s director of data strategy confirmed that the secret behind client retention for Coca-Cola is big data analytics.
- In 2017, the company launched a new flavour – Cherry Sprite. It was inspired by figures collected from self-service drinks fountains that let customers mix their own drinks. Coca-Cola discovered the most popular flavour combo and turned it into a beverage.
Targeted ads: Netflix
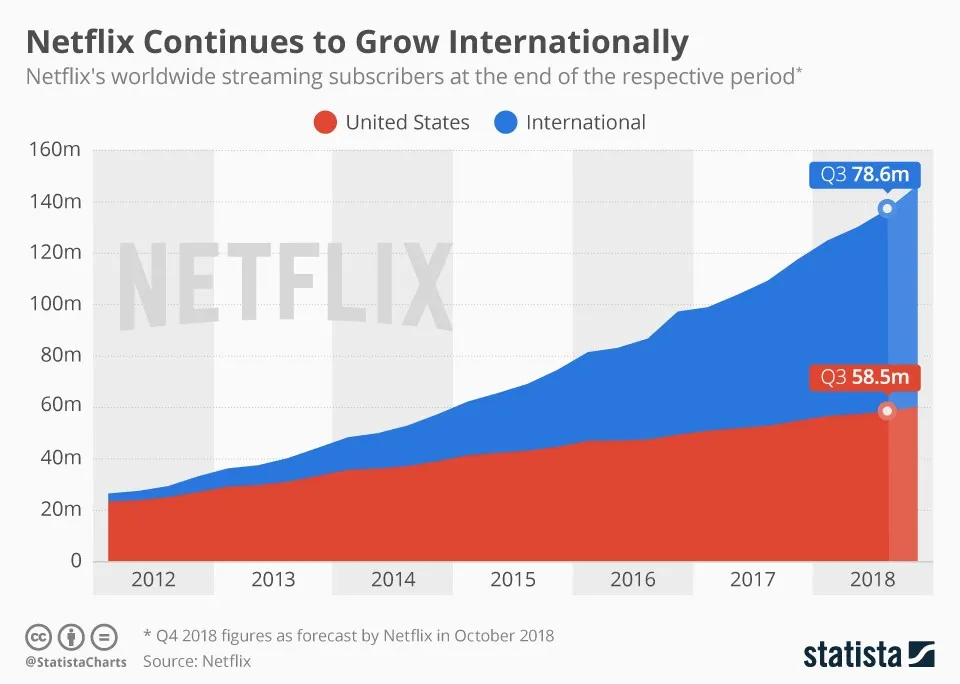
Netflix uses big data analytics for targeted advertising. It has more than 100 million loyal clients and collects enormous amounts of data on a daily basis. By making successful suggestions as to what movie or series the user should watch next, they’ve become as addictive as cocaine.
Risk management: UOB bank
Singapore-based UOB Bank applied data analytics to reduce risks. As such, the security of the whole institution depends on the accuracy and speed of data processing.
- For example, through the analysis of their customers’ data, they provide more personalised offers for client retention, optimise business processes and improve cyber-security. What used to take hours to complete with the latest technologies now occupies just a few moments.
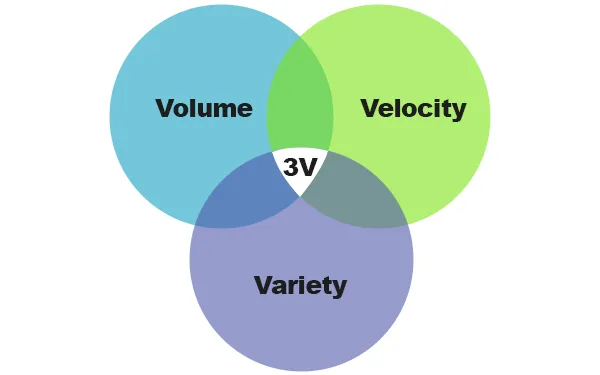
Have you heard of 3V of Big Data: variety, volume, and velocity?
These are the most common dimensions of big data measurements. Variety refers to the number of data types, mentioned above, volume refers to the total amount of aggregated data, and velocity refers to the speed of data processing.
Some researches add another V: Variability. So, we got 4V.
Variability shows the data dispersion and is measured with the classical metrics of math statistics: range, variance and standard deviation.
By this link, you’ll find additional information about these factors.
To sum up
Big data analysis creates advantages for the business owners by showing the not evident connections of courses and consequences.
This lead to improvement of the forecasting and planning, reduction of the pick loads and operative costs, and optimisation of the business flow.
With the help of IT experts who combine deep mathematical knowledge with advanced programming capabilities, your firm can realise productivity magnification and outstrip your competitors.

Pavel Shevtsov
Pavel Shevtsov is a seasoned professional in the field of software development, currently serving as the Managing Director at Magora, a leading software development company known for its innovative solutions. With a passion for leveraging technology to solve complex business challenges, Pavel has played a pivotal role in Magora's growth and success.
LinkedIn